Performance Visualisation Tools
The performance data are acquired from Dino-run46, carried out in BasCat, TU Berlin. The primary aim of this run, was to understand the impact of employing different compositions on catalytic performance in syngas to ethanol (StE) reaction.
The four following catalytic compositions were tested:
Rh/SiO2
RhMn/SiO2
RhFE/SiO2
RhMnFe/SiO2
bypass
Reactor-based Visualisations
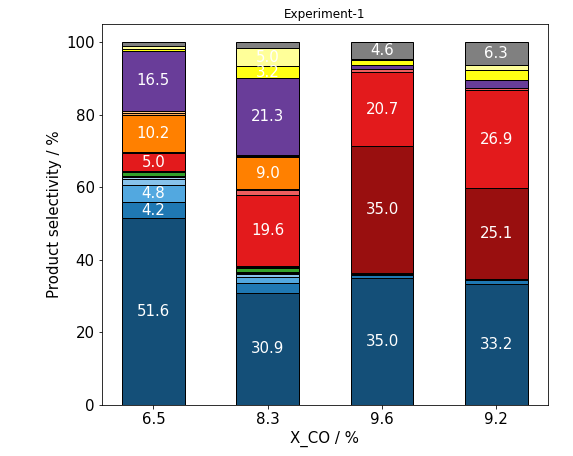
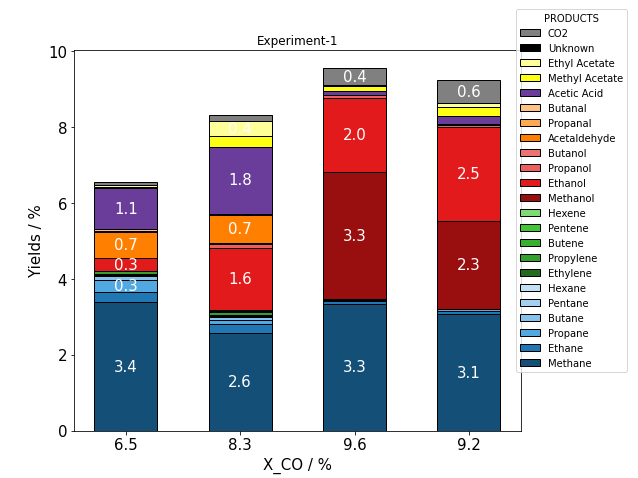
Experiment-based Visualisation
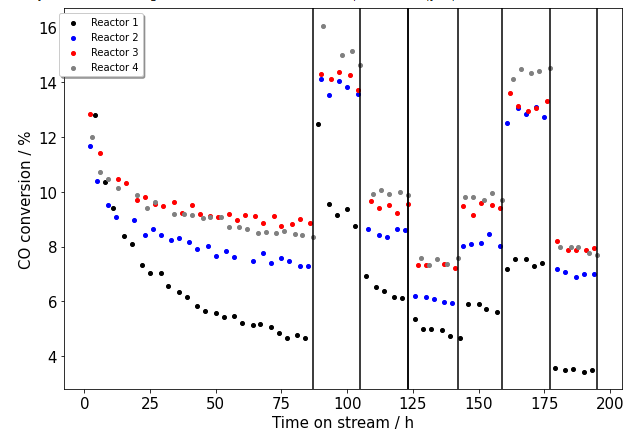
Performance vs Time-On-Stream (TOS)
This function depicts the CO conversion for all tested catalysts across entire TOS.
Demo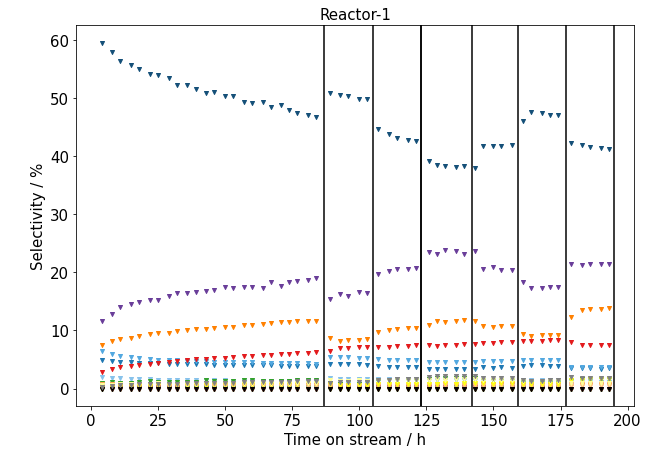
Reactor-Based Selectivity vs Time-On-Stream (TOS)
This function depicts for each reactor a scatter plot of the selectivity of products for each single measured point across entire TOS.
Demo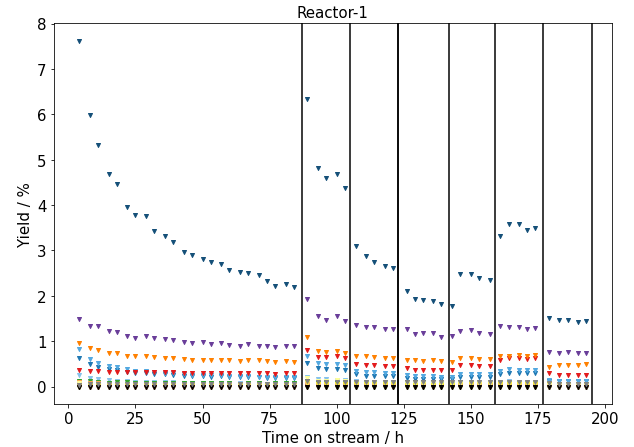
Reactor-Based Yield vs Time-On-Stream (TOS)
This function depicts for each reactor a scatter plot of the yield of products for each single measured point across entire TOS.
Demo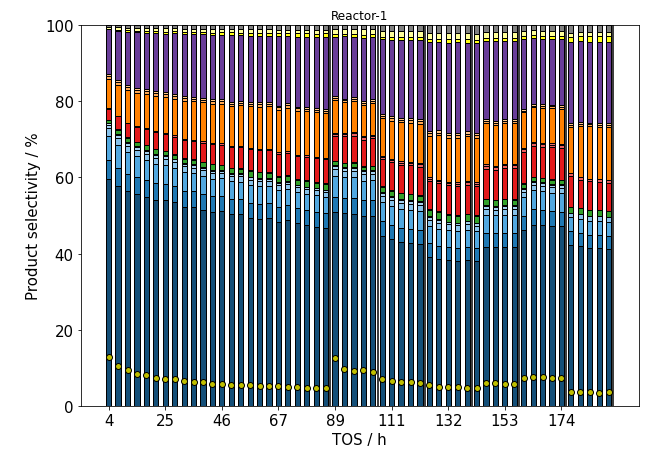
Reactor-Based Stacked-Bar Selectivity vs. Time-On-Stream (TOS) Plot
This function depicts for each reactor stacked bar plot of the selectivity of products for each single measured point across entire TOS.
Demo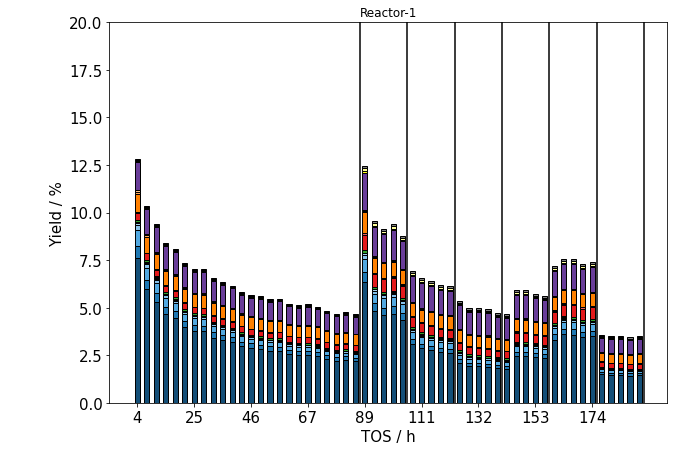
Reactor-Based Stacked-Bar Yield vs. Time-On-Stream (TOS) Plot
This function depicts for each reactor stacked bar plot of the yield of products for each single measured point across entire TOS.
Demo
DASH_ANALYSER
BasCat 3D Catalyst analysis tool. Built on top of the Plotly JavaScript library, plotly enables Python users to create beautiful interactive web-based visualizations that can be displayed in Jupyter notebooks, saved to standalone HTML files, or served as part of pure Python-built web applications using Dash.
DemoBASCAT ML TOOLS
BASCAT dash app, which can be use to perform rudimentary ML data cleaning and modelling on any data set provided by the user.
Demo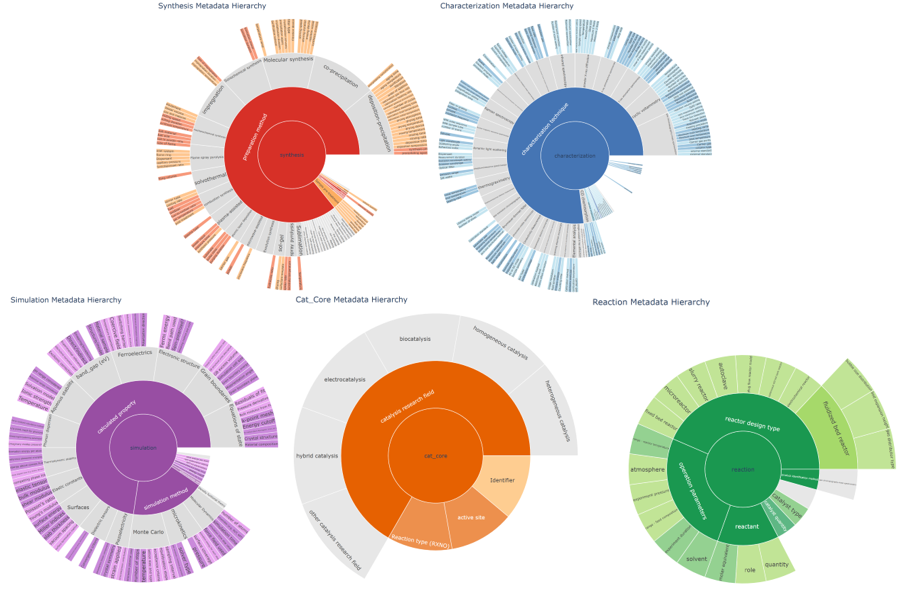
BASCAT Catalyst Meta Vocabulary
BASCAT Meta Vocabulary (MetaCat) is a web application that provides a comprehensive and standardized vocabulary for catalysis research. It is designed to facilitate data sharing, integration, and analysis across different research groups and platforms.
Demo